


25 February 2022 | Blog
It’s no secret that the number of cybersecurity incidents and attacks has been growing over the past few years. But what exactly are the numbers? As part of our Security Navigator report, we conducted extensive research into the incident landscape of 2021. What kind of attacks did we see occur the most? Are the effects different for large or small organizations? And which sectors got hit the most?
From October 2020 to September 2021, we identified a total of 94.806 incidents from our customers, up from 45.398 in 2020. Of the incidents, 36% can be confirmed as security incidents.
A note on terminology: we log an event that has met certain conditions and is thus considered an Indicator of Compromise, Attack or Vulnerability. An Incident is when this logged Event, or several Events, are correlated or flagged for investigation by a human – our security analysts. An Incident is considered ‘confirmed’ when, with help of the customer or at the discretion of the analyst, we can determine that security was indeed compromised.
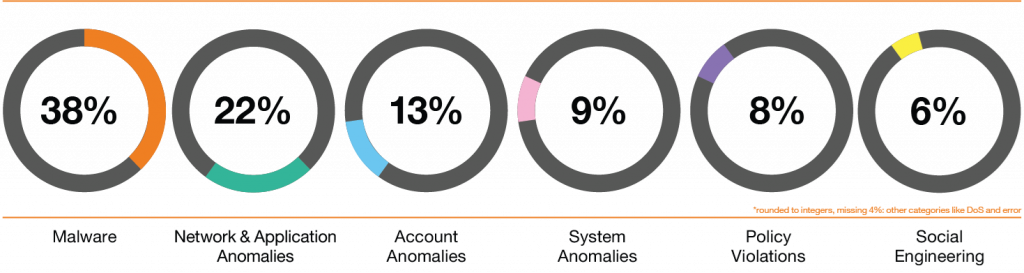
In 2021, we detected the following incident types:
Malware is malicious software such as ransomware.
Network & Application Anomalies, such as tunneling, IDS/IPS alerts and other attacks related to network traffic and applications.
Account Anomalies, such as brute force attacks, reusing credentials, lateral movement, elevation of privileges or similar kinds of incidents.
System Anomalies are events directly related to the OS and the components around it like drivers that stop working or services that are terminated unexpectedly.
Policy Violations, such as installing unsupported software or connecting an unauthorized device to the network.
Social Engineering is any attempt to fool users; including, but not limited to, phishing and spoofing.
One thing that stands out in all the data is that we see a shift in our incident type distribution. With 38% of total incidents, malware has become the number one incident type.
Network & Application Anomalies, which was the number one incident type in 2020 with 35%, has moved to second place with 22%. A significant decrease.
The increase of malware incidents can partly be explained by some of our larger customers increasing their detection capabilities towards malware. Additionally, there generally was more malware activity over the past 12 months, especially during March 2021 and June 2021, where we saw the highest amount of confirmed security incidents.
Within our observations, we make a distinction between organizational size to classify our customers. We differentiate between business sizes as the following:
Of all the customers considered in our report:
We see incident volumes that correlate to the business size, thus larger operations see more incidents. There is one exception that stands out this year: small businesses were alerted more on potential Malware incidents than medium-sized, and resulting from this, experienced 38% more confirmed malware incidents than medium-sized businesses.
One explanation for this statistic could be that small-sized organizations have less time and resources for their IT security, therefore making it “easier” for malware to find its way into an organization.
The organizations categorized as medium-sized stand out for their high amount of raised network & application anomalies this year. The number of incidents was even higher than those for large organizations. Additionally, this group has a smaller number of confirmed incidents in comparison to small organizations in the categories of policy violations, malware and social engineering. Making medium-sized businesses go against the ‘normal’ of incident volume vs. sheer size in four out of the seven incident categories.
Overall, large organizations see the highest number of malware incidents, with almost twice as many confirmed incidents compared to last year. For instance, similar to last year, large-sized organizations had almost half of the amount of network-related incidents compared to small organizations.
One interesting observation is that when zooming in to incidents concerning confirmed ransomware-related incidents, large organizations have had as few confirmed incidents as small organizations. Or to turn this around, small organizations had as many confirmed ransomware-related incidents as large organizations.
In addition to business size, we reviewed our data across the different business sectors. Even though differences can be detected, in the end we see all industries struggle with increasingly advanced attacks.
In our research, we have collected a great number of statistics for the different sectors. Here are a few interesting highlights:
With more than 30% of all confirmed incidents, we saw a shift this year with malware being the number one incident. It is a trend that not necessarily shows in the overall threat landscape’s current status but does provide insight into what we are seeing our customers struggling with the most.
Although differences occur in the type of incidents across different business sizes and industries, we see organizations of all shapes and sizes dealing with similar issues. In the end, everyone is a target of the evolving adversary with a refined set of advanced tools.
25 February 2022 | Blog

4 November 2021 | Blog

13 December 2021 | Blog